Back to Dashboard
Calicoctl included in
With
with
with
Quick setup for
Log collector scripts
Rancher 2.x
curl -Ls rnch.io/rancher2_logs | sudo bash
Rancher 1.6
curl -Ls http://rnch.io/rancher16_logs | sudo bash
Quick collection of all Rancher 2.x pod logs
for pod in $(kubectl get pods -n cattle-system -l app=rancher --no-headers -o custom-columns=":metadata.name")
  do
    kubectl logs -n cattle-system $pod -c rancher |& gzip > $pod.log.gz
    kubectl logs -n cattle-system $pod -c rancher -p |& gzip > $pod.previous.log.gz
done
Also, this script in our support-tools repo which can temporarily enable debug logging and automate the collection
Interactively watch all Rancher 2.x pod logs
kubectl logs -n cattle-system -l app=rancher -f -c rancher --tail=100
Quick collection of CoreDNS and node-local-dns pod logs (RKE1 & RKE2)
for pod in $(kubectl get pods -n kube-system -l k8s-app=kube-dns --no-headers -o custom-columns=":metadata.name")
  do
    kubectl logs -n kube-system $pod |& gzip > $pod.log.gz
    kubectl logs -n kube-system $pod -p |& gzip > $pod.previous.log.gz
done

for pod in $(kubectl get pods -n kube-system -l k8s-app=node-local-dns --no-headers -o custom-columns=":metadata.name")
  do
    kubectl logs -n kube-system $pod |& gzip > $pod.log.gz
    kubectl logs -n kube-system $pod -p |& gzip > $pod.previous.log.gz
done
Quick collection of cluster and node-agent pod logs
for pod in $(kubectl get pods -n cattle-system -l app=cattle-cluster-agent --no-headers -o custom-columns=":metadata.name")
  do
    kubectl logs -n cattle-system $pod |& gzip > $pod.log.gz
    kubectl logs -n cattle-system $pod -p |& gzip > $pod.previous.log.gz
done
for pod in $(kubectl get pods -n cattle-system -l app=cattle-agent --no-headers -o custom-columns=":metadata.name")
  do
    kubectl logs -n cattle-system $pod |& gzip > $pod.log.gz
    kubectl logs -n cattle-system $pod -p |& gzip > $pod.previous.log.gz
done
Quick collection of eks-operator pod logs
kubectl logs -n cattle-system -l ke.cattle.io/operator=eks --tail=-1 &> eks-operator.log
Quick collection of aks-operator pod logs
kubectl logs -n cattle-system -l ke.cattle.io/operator=aks --tail=-1 &> aks-operator.log
Rancher Profile Collection Script
TS=`date -u +"%Y-%m-%d_%H%M"`
pprofs=( goroutine heap threadcreate block mutex )
for pod in $(kubectl -n cattle-system get pods --no-headers -l app=rancher -o custom-columns=":.metadata.name"); do
  echo "getting profile for $pod..."
  for pp in ${pprofs[@]}; do
    echo "--> generating $pp..."
    kubectl -n cattle-system exec $pod -c rancher -- curl -s http://localhost:6060/debug/pprof/$pp -o $pp
  done
  echo "--> taring it up..."
  kubectl -n cattle-system exec $pod -c rancher -- tar -czf debug-pprof.tar.gz $pprofs
  kubectl -n cattle-system cp -c rancher $pod:debug-pprof.tar.gz $pod-debug-pprof-$TS.tar.gz
  echo saved debug profile $pod-debug-pprof-$TS.tar.gz
done
Analyze heap profile using:
go tool pprof -top heap
go tool pprof -png heap > call-graph.png
Cleanup script
Cleans up all docker containers/images/networks
wget https://github.com/rancherlabs/support-tools/raw/master/extended-rancher-2-cleanup/extended-cleanup-rancher2.sh
sudo bash extended-cleanup-rancher2.sh
RoleBinding cleanup job
wget https://raw.githubusercontent.com/rancher/rancher/master/cleanup/binding-clean.sh
bash ./binding-clean.sh rancher/rancher-agent:v2.5.6 -dry-run
Note, if it fails to deploy the script will re-attempt to create the job object, delete the cleanup-job job/pod first.
Runlike
Provides the full
docker run command required to re-create the named containerdocker run --rm -v /var/run/docker.sock:/var/run/docker.sock axeal/runlike <containername>
Create admin kubeconfig for cluster
Now moved to https://github.com/rancherlabs/support-tools/tree/master/how-to-retrieve-kubeconfig-from-custom-cluster
Quick manual snapshot of etcd (RKE1)
docker exec etcd etcdctl snapshot save /tmp/snapshot.db && docker cp etcd:/tmp/snapshot.db .
Repair cluster agents
kubectl annotate clusters.management.cattle.io <REPLACE_WITH_CLUSTERID> io.cattle.agent.force.deploy=true
OR:
kubectl patch clusters.management.cattle.io <REPLACE_WITH_CLUSTERID> -p '{"status":{"agentImage":"dummy"}}' --type merge
Note: if an an import command has been re-run on an imported cluster, the above annotation for the cluster object can be used to force Rancher to redeploy the full agent manifest. The initial agent deployment from the import command does not contain the full spec that Rancher maintains after being imported.
Increase Rancher loglevel
LEVEL=info # change to debug, etc.

for rancherpod in `kubectl get pods -n cattle-system -l app=rancher --template '{{range.items}}{{.metadata.name}}{{"\n"}}{{end}}'`
  do
    echo $rancherpod
    kubectl exec -n cattle-system $rancherpod -- loglevel --set $LEVEL
  done
Or use our script to automate the temporary debug loglevel and capture the logs
Save rancher-wins service logs (Windows)
Get-EventLog -LogName Application -Source rancher-wins > wins.log
Get-EventLog -LogName Application -Source rke2 > rke2.log
Checking Windows RKE2 logs
Some examples for
rke2 and rancher-winsGet-EventLog -LogName Application -Source rke2 -Newest 50 | Format-Table -AutoSize -Wrap
Get-EventLog -LogName Application -Source rancher-wins -Newest 50 | Format-Table -AutoSize -Wrap
Kubelet, kube-proxy and CSI logs are in:
C:\var\lib\rancher\rke2\agent\logsCreate a profile and flame graph
apt install perf-tools-unstable ## Ubuntu
apt install linux-tools-5.8.0-1038-aws ## Specific to distro/version
perf record -F 99 -p $(pidof k3s-server) -g -- sleep 60
perf script > out.perf
git clone https://github.com/brendangregg/FlameGraph.git
./stackcollapse-perf.pl out.perf > out.folded
./flamegraph.pl out.folded > perf.svg
List Rancher objects nicely
Clusters
kubectl get clusters.management.cattle.io -o custom-columns="ID:.metadata.name,NAME:.spec.displayName,DRIVER:.status.driver,K8S_VERSION:.status.version.gitVersion,CREATED:.metadata.creationTimestamp,DELETED:.metadata.deletionTimestamp,LAST_READY:.status.conditions[?(@.type == 'Ready')].lastUpdateTime,READY:.status.conditions[?(@.type == 'Ready')].status" --sort-by=.metadata.creationTimestamp
Nodes
kubectl get nodes.management.cattle.io -A -o custom-columns="NAMESPACE:.metadata.namespace,ID:.metadata.name,NAME:.status.nodeName,K8S:status.internalNodeStatus.nodeInfo.kubeletVersion,CP:spec.controlPlane,ETCD:spec.etcd,WORKER:spec.worker,OS:status.internalNodeStatus.nodeInfo.osImage,KERNEL:.status.internalNodeStatus.nodeInfo.kubeletVersion"
Machines with machine-id
kubectl get machine.cluster.x-k8s.io -n fleet-default -o custom-columns="CLUSTER:.metadata.labels.cluster\.x-k8s\.io/cluster-name,NAME:.metadata.name,CREATED:.metadata.creationTimestamp,MACHINE-ID:..metadata.labels.rke\.cattle\.i
o/machine-id"
Users
kubectl get users.management.cattle.io user-nvs7c -o custom-columns=ID:'{.metadata.name},Name:'{.username},DisplayName:'{.displayName}'
Tokens
kubectl get tokens.management.cattle.io -o custom-columns=Name:'{.metadata.name}',ID:'{.userId}',DisplayName:'{.userPrincipal.displayName}',User:'{.userPrincipal.loginName}',Created:'{.metadata.creationTimestamp}'
Kubernetes
Find leader leases
kubectl get leases -A
Find leader components (individual method) - for old k8s versions, may not work
#### kube-controller-manager
kubectl -n kube-system get endpoints kube-controller-manager -o jsonpath='{.metadata.annotations.control-plane\.alpha\.kubernetes\.io/leader}'

#### kube-scheduler
kubectl -n kube-system get endpoints kube-scheduler -o jsonpath='{.metadata.annotations.control-plane\.alpha\.kubernetes\.io/leader}'

#### rancher before 2.8.3
kubectl -n kube-system get configmap cattle-controllers -o jsonpath='{.metadata.annotations.control-plane\.alpha\.kubernetes\.io/leader}'

#### rancher after 2.8.3
kubectl -n kube-system get lease cattle-controllers -o json | jq -r '.spec.holderIdentity'
Test permission of a specific user
kubectl auth can-i get clusters/<clusterID> --as <userID>
kubectl hacks
Check API endpoints
kubectl get --raw='/readyz?verbose'
OR, from a control plane node
curl -k
https://localhost:6443/livez?verbose
List all resources in a namespace
kubectl api-resources --verbs=list --namespaced -o name | xargs -n 1 kubectl get --show-kind --ignore-not-found -n <namespace>
Count of all Kubernetes objects
for i in $(kubectl api-resources --verbs=list -o name | sort -n); do
  echo -n "$i : "
  kubectl get $i -A --no-headers 2>/dev/null | wc -l
done
List all running pods by restart count
kubectl get pods --sort-by="{.status.containerStatuses[:1].restartCount}" -A
List all pods by node
kubectl get pods -o wide --sort-by="{.spec.nodeName}" -A
Sort nodes by age
kubectl get nodes --sort-by=".status.conditions[?(@.reason == 'KubeletReady' )].lastTransitionTime"
List all not Running pods
kubectl get pods --field-selector="status.phase!=Succeeded,status.phase!=Running" -A
List all pods with PVC
kubectl get pods --all-namespaces -o=json | jq -c '.items[] | {name: .metadata.name, namespace: .metadata.namespace, claimName: .spec | select( has ("volumes") ).volumes[] | select( has ("persistentVolumeClaim") ).persistentVolumeClaim.claimName }'
List all namespaces with project IDs
kubectl get ns -A -o json | jq '.items[] | {name: .metadata.name, projectid: .metadata.labels."field.cattle.io/projectId"}'
With cluster:project ID format
kubectl get ns -A -o json | jq '.items[] | {name: .metadata.name, projectid: .metadata.annotations."field.cattle.io/projectId"}'
List all pods running on etcd or control plane
##### etcd
for n in $(kubectl get nodes -l node-role.kubernetes.io/etcd=true --no-headers | cut -d " " -f1)
  do
    kubectl get nodes --field-selector metadata.name=${n} --no-headers; kubectl get pods --all-namespaces -o wide --field-selector spec.nodeName=${n}; echo
done

# controlplane
for n in $(kubectl get nodes -l node-role.kubernetes.io/controlplane=true --no-headers | cut -d " " -f1)
  do
    kubectl get nodes --field-selector metadata.name=${n} --no-headers; kubectl get pods --all-namespaces -o wide --field-selector spec.nodeName=${n}; echo
done
List all namespaces by cluster-id:project-id
kubectl get ns -A -o json | jq '.items[] | {name: .metadata.name, projectid: .metadata.annotations."field.cattle.io/projectId"}'
List all namespaces by just project-id
kubectl get ns -A -o json | jq '.items[] | {name: .metadata.name, projectid: .metadata.labels."field.cattle.io/projectId"}'
Delete all pods with a certain status
Eg, Failed status in the current namespace:
kubectl delete pod --field-selector="status.phase==Failed"
Force delete all pods not in a Running state (warning: potentially harmful):
kubectl -A --no-headers get pods | awk '{if ($4 != "Running") system ("kubectl -n " $1 " delete pod " $2 " --grace-period=0 " " --force ")}'
Decode a secret oneliner
The below decodes a secret with multiple keys within
data, in this case only decode the alertmanager.yaml keykubectl get secret -n <namespace> <secret> -o=go-template='{{index .data "alertmanager.yaml"}}' | base64 -D
Regenerate all SA tokens
WARNING: This is fairly desctructive, intended for worst case scenarios where the tokens got invalidated, such as when the CA got recreated. Credit to this gist.
kubectl get secret -A | awk '{ if ($3 == "kubernetes.io/service-account-token") system("kubectl -n " $1 " delete secret " $2) }'
kubectl get po -A | awk '{ if ($4 =="CrashLoopBackOff") system("kubectl delete po --force --grace-period=0 -n " $1 " " $2) }'
kubectl get po -A | awk '{ if ($4 =="Terminating") system("kubectl delete po --force --grace-period=0 -n " $1 " " $2) }'
kubectl get po -A | awk '{ if ($4 =="Error") system("kubectl delete po --force --grace-period=0 -n " $1 " " $2) }'

##### Optional - all pods
kubectl delete pods -A --all --force --grace-period=0
Collect pprof profiling data from kube-apiserver
In RKEv1 profiling is not enabled on the kube-apiserver by defaults, edit the cluster as YAML to add:
  services:
    kube-api:
      extra_args:
        profiling: 'true'
With the above in place, once there is a control plane node experiencing the issue, SSH in and use the following steps (while the issue is occurring).
- (Optional), if the kubectl binary is not installed, copy it from the kubelet container:
docker cp kubelet:/usr/local/bin/kubectl . - Generate a kubeconfig to use against this node, this is optional, however the kubeconfig generated will use
127.0.0.1:6443which is perfect for this temporary use case: - Start a kubectl proxy session in the background (assumes the above steps were used exactly, modify slightly if needed):
./kubectl --kubeconfig kubeconfig_admin.yaml proxy & - Obtain profiling data with the below loop:
for i in allocs block goroutine heap mutex threadcreate trace
  do
    echo $i
    curl -s http://127.0.0.1:8001/debug/pprof/$i -o $i
done
If you're interested, with the golang installed you can either:
- View in a web browser: go tool pprof -http=: <file name>
- View interactively: go tool pprof <file name>, once open use commands like top 20 to see a listing.
Linux
Monitor all process activity in one shot (needs sysstat package)
pidstat -drshut -p ALL
ingress-nginx
Slow ingress-nginx requests
kubectl logs -n ingress-nginx -l app=ingress-nginx -f --tail=10000 | awk '/- -/ && $(NF-2)>1.0'
Adjust
1.0 to suit, this retrieves log entries with a >1.0s upstream_response_timeThe same can be done for
request_time:kubectl logs -n ingress-nginx -l app=ingress-nginx -f --tail=10000 | awk '/- -/ && $(NF-7)>2.0'
Exclude access.log output from ingress-nginx logs
This should exclude the access.log output, to focus only on the controller and error.log output
kubectl logs -n ingress-nginx -l app=ingress-nginx -f --tail=100 | awk '!/- -/'
(RKE1) Quick collection of ingress-nginx pod logs
for pod in $(kubectl get pods -n ingress-nginx -l app.kubernetes.io/component=controller --no-headers -o custom-columns=":metadata.name")
  do
    kubectl logs -n ingress-nginx $pod |& gzip > $pod.log.gz
    kubectl logs -n ingress-nginx $pod -p |& gzip > $pod.previous.log.gz
done
(RKE2) Quick collection of ingress-nginx pod logs
for pod in $(kubectl get pods -n kube-system -l app.kubernetes.io/component=controller --no-headers -o custom-columns=":metadata.name")
  do
    kubectl logs -n kube-system $pod |& gzip > $pod.log.gz
    kubectl logs -n kube-system $pod -p |& gzip > $pod.previous.log.gz
done
(RKE1) Test all pods in a service from ingress-nginx pods
SERVICE=test-service
NAMESPACE=default
PORT=80

for ingresspod in $(kubectl -n ingress-nginx get pods -l app=ingress-nginx --template '{{range.items}}{{.metadata.name}}{{"\n"}}{{end}}')
  do
    echo $ingresspod
    for svcep in $(kubectl -n $NAMESPACE get ep $SERVICE -o json | jq -r '.subsets[].addresses[].ip')
      do
        echo "=> ${svcep}"
        kubectl -n ingress-nginx exec $ingresspod -- curl -o /dev/null -s -w 'Connect: %{time_connect}\nStart Transfer: %{time_starttransfer}\nTotal: %{time_total}\nResponse code: %{http_code}\n' -k http://${svcep}:${PORT}
        echo
      done
  done
(RKE2) Test all pods in a service from ingress-nginx pods
SERVICE=test-service
NAMESPACE=default
PORT=80

for ingresspod in $(kubectl -n kube-system get pods -l app.kubernetes.io/component=controller --template '{{range.items}}{{.metadata.name}}{{"\n"}}{{end}}')
  do
    echo $ingresspod
    for svcep in $(kubectl -n $NAMESPACE get ep $SERVICE -o json | jq -r '.subsets[].addresses[].ip')
      do
        echo "=> ${svcep}"
        kubectl -n kube-system exec $ingresspod -- curl -o /dev/null -s -w 'Connect: %{time_connect}\nStart Transfer: %{time_starttransfer}\nTotal: %{time_total}\nResponse code: %{http_code}\n' -vk http://${svcep}:${PORT}
        echo
      done
  done
Note: If the protocol is different adjust
http:// to suitTest all Rancher pods from ingress-nginx pods (needs Rancher kubeconfig)
for ingresspod in $(kubectl get pods -n kube-system -l app.kubernetes.io/name=rke2-ingress-nginx --template '{{range.items}}{{.metadata.name}}{{"\n"}}{{end}}')
  do
    echo $ingresspod
    for rancherep in $(kubectl -n cattle-system get ep rancher -o json | jq -r .subsets[].addresses[].ip)
      do
        echo "=> ${rancherep}"
        kubectl -n kube-system exec $ingresspod -- curl -o /dev/null -s -w 'Connect: %{time_connect}\nStart Transfer: %{time_starttransfer}\nTotal: %{time_total}\nResponse code: %{http_code}\n' -k https://${rancherep}
        echo
      done
  done
Goaccess to analyse ingress-nginx access logs
Examples with kubectl use the last 48hours of log output (
--since=48h)RKE1
Terminal output:
kubectl logs -f -n ingress-nginx -l app=ingress-nginx --since=48h | goaccess --log-format="%h - - [%d:%t] \"%m %r %H\" %s %b \"%R\" \"%u\" %^ %T [%v]" --time-format '%H:%M:%S %z' --date-format "%d/%b/%Y"
Real-time HTML output (open report.html in a browser):
kubectl logs -f -n ingress-nginx -l app=ingress-nginx --since=48h | goaccess --log-format="%h - - [%d:%t] \"%m %r %H\" %s %b \"%R\" \"%u\" %^ %T [%v]" --time-format '%H:%M:%S %z' --date-format "%d/%b/%Y" --real-time-html -o ./report.html
Read from a file (note: this removes the first column timestamp added by
docker logs):cut -d" " -f2- <file> | goaccess --log-format="%h - - [%d:%t] \"%m %r %H\" %s %b \"%R\" \"%u\" %^ %T [%v]" --time-format '%H:%M:%S %z' --date-format "%d/%b/%Y"
ingress-nginx heap and trace
When logged into the node, can also be run against the node IP
##### Heap
curl -s http://localhost:10254/debug/pprof/trace?seconds=5 --output /tmp/nginx-trace.$(date -u --iso-8601=seconds)

##### Trace
curl -s http://localhost:10254/debug/pprof/heap --output /tmp/nginx-heap.$(date -u --iso-8601=seconds)
default-backend metrics
curl `kubectl get pods -n ingress-nginx -l app=default-http-backend -o json | jq -r '.items[] | .status.podIP'`:10254/metrics
Networking
Calico/Canal
Calicoctl included in calico-node image, oneliner from a node
kubectl exec -it -n kube-system $(kubectl get pods -n kube-system -l k8s-app=canal --no-headers -o custom-columns=":metadata.name") -c calico-node -- /calicoctl version

##### replace -l k8s-app=calico for calico
Output Calico installation values
kubectl get installation -o yaml
Cilium
Get endpoint health for a Cilium container
kubectl -n kube-system exec -ti $CILIUM_CONTAINER -- cilium endpoint health 1537
kubectl -n kube-system exec -ti $CILIUM_CONTAINER -- cilium endpoint health get 1537
Watch for issues
kubectl -n kube-system exec -ti $CILIUM_CONTAINER -- cilium monitor -v --related-to 1537
Print the Cilium status
kubectl -n kube-system exec ds/cilium -c cilium-agent -- cilium status
List node endpoints
kubectl -n kube-system exec -ti $CILIUM_CONTAINER -- cilium bpf tunnel list
Weave
docker exec -it $(docker ps -q --filter name=k8s_weave_weave-net) ./weave --local status
docker exec -it $(docker ps -q --filter name=k8s_weave_weave-net) ./weave --local status peers
docker exec -it $(docker ps -q --filter name=k8s_weave_weave-net) ./weave --local status connections
Check all CoreDNS replicas
  ##### Get a list of CoreDNS endpoints
kubectl get endpoints -n kube-system kube-dns -o=jsonpath='{.subsets[*].addresses[*].ip}'

  ##### Use the IP list above to add to the below loop
for coredns in <space separated list here>
  do
    echo "-- resolving against $coredns"
    dig +short kubernetes.default.svc.cluster.local. @$coredns >& /dev/null
done
Port testing
These are useful if commands are limited, especially
/dev/tcp which should be possible without any nc or curl etc.With nc
nc -vz 127.0.0.1 2379
with curl
curl -v telnet://127.0.0.1:2379
with /dev/tcp
echo > /dev/tcp/127.0.0.1/2379
echo $?
Exit code 0 represents success
Alternatively, you can output the response:
cat < /dev/tcp/127.0.0.1/22
Socket count by user
grep -w sock lsof | awk '{print $1}' | sort | uniq -c | sort | tail
Get pod IPs from Docker
for ctid in $(docker ps -q --filter name=k8s_POD); do echo "$ctid"; docker inspect --format '{{ .Name }}' $ctid; nsenter --net=$(docker inspect --format '{{ .NetworkSettings.SandboxKey }}' $ctid) ifconfig eth0 | grep 'inet addr'; done
Ping with a set MTU and prohibit fragmentation
ping -M do -s 1450 IP
Curl hackery
Curl Rancher and check connectivity.
To the FQDN:
To the FQDN:
curl -v -k https://rancher-sandbox.com/ping
Locally from Rancher node:
From inside Rancher container:Output like that included below implies a break in connection between the source and destination on the return route from destination to source. A successful curl of Rancher's 'ping' will return a payload of
pong after the handshakes.curl -v -k https://rancher-sandbox.com/ping
* Trying 10.196.205.7:443...
* Connected to rancher-sandbox.pwc.com (10.196.205.7) port 443 (#0)
* ALPN, offering h2
* ALPN, offering http/1.1
* successfully set certificate verify locations:
* CAfile: /etc/ssl/certs/ca-certificates.crt
* CApath: none
* TLSv1.3 (OUT), TLS handshake, Client hello (1):
* OpenSSL SSL_connect: SSL_ERROR_SYSCALL in connection to rancher-sandbox.pwc.com:443
* Closing connection 0
curl: (35) OpenSSL SSL_connect: SSL_ERROR_SYSCALL in connection to rancher-sandbox.pwc.com:443
Pass an SNI compliant request direct to an IP, useful to sending traffic to a node directly instead of behind a load balancer
##### Connect using a different port on the node (NodePort for example), this is useful for Istio where a Gateway might be configured to listen on the port that the load balancer is listening (443)
curl --connect-to example.com:443:<ip address>:31390 https://example.com/

##### Set the host header as needed while connecting to an IP, when no port changes are needed
curl --resolve www.example.com:443:192.0.2.1 https://www.example.com/
Perform requests with a proxy protocol header (
--haproxy-procotol)curl --haproxy-protocol --resolve www.example.com:443:192.0.2.1 https://www.example.com/
Obtain connection stats
curl -OLs https://raw.githubusercontent.com/rancherlabs/support-tools/master/files/curl-format.txt
curl -vw "@curl-format.txt" endpoint.com
Openssl equivalent
openssl s_client -tlsextdebug -msg -servername example.com -connect <ip address>:443
nsenter / sidecar to use a pods network namespace
#### nsenter
ID=<contaier ID or name>
PID=$(docker inspect --format '{{ .State.Pid }}' $ID)
nsenter -a -t $PID <command>

#### Sidecar
docker run -it --net=container:$ID --pid=container:$ID --volumes-from=$ID leodotcloud/swiss-army-knife sh
Capture the Docker socket with socat
#### backup the socket
sudo mv /var/run/docker.sock /var/run/docker.sock.original
#### use tcp port 8089 proxy the original socket
sudo socat TCP-LISTEN:8089,reuseaddr,fork UNIX-CONNECT:/var/run/docker.sock.original
#### use the new socket to proxy the 8089 port
sudo socat UNIX-LISTEN:/var/run/docker.sock,fork TCP-CONNECT:127.0.0.1:8089
sudo tcpdump -i lo -netvv port 8089
Tcpdump to grab only headers
#### On port 80
sudo tcpdump -A -s 10240 'tcp port 80 and (((ip[2:2] - ((ip[0]&0xf)<<2)) - ((tcp[12]&0xf0)>>2)) != 0)' | egrep --line-buffered "^........(GET |HTTP\/|POST |HEAD )|^[A-Za-z0-9-]+: " | sed -r 's/^........(GET |HTTP\/|POST |HEAD )/\n\1/g'

#### With nsenter, all ports:
nsenter -n -t $PID tcpdump -A -s 10240 '(((ip[2:2] - ((ip[0]&0xf)<<2)) - ((tcp[12]&0xf0)>>2)) != 0)' | egrep --line-buffered "^........(GET |HTTP\/|POST |HEAD )|^[A-Za-z0-9-]+: " | sed -r 's/^........(GET |HTTP\/|POST |HEAD )/\n\1/g'
Calico - Ip-over-IP - Tcpdump to trace Pod to Pod packet flow
Step 1 - Convert Pod IP to Hex
IPIP_SRC_DST=$(echo "10.42.101.129" |awk -F "." '{printf "0x%02X%02X%02X%02X\n", $1,$2,$3,$4}')
Step 2 - Use offset 32 with length 4 (33 to 36) for request or use offset 36 with length 4 (37 to 40) for the destination to capture tunneled packet
tcpdump -n -vvv -i any ip[32:4]==${IPIP_SRC_DST} || ip[36:4]==${IPIP_SRC_DST}
Sample output:-
tcpdump: listening on any, link-type LINUX_SLL (Linux cooked), capture size 262144 bytes
15:42:20.317585 IP (tos 0x0, ttl 62, id 59254, offset 0, flags [none], proto IPIP (4), length 106)
    172.105.61.190 > 172.104.207.6: IP (tos 0x0, ttl 63, id 10439, offset 0, flags [none], proto UDP (17), length 86)
    10.42.101.129.34829 > 10.42.71.129.53: [udp sum ok] 29872+ A? www.google.com.default.svc.cluster.local. (58)
Canal - VXLAN - Tcpdump to trace Pod to Pod packet flow
Step 1 - Convert Pod IP to Hex
IPIP_SRC_DST=$(echo "10.42.0.10" |awk -F "." '{printf "0x%02X%02X%02X%02X\n", $1,$2,$3,$4}')
Step 2 - Use offset 62 with length 4 (63 to 66) for request or use offset 66 with length 4 (67 to 70) for the destination to capture tunneled packet
tcpdump -n -vvv -i eth0 "port 8472 and ( ip[62:4]==${IPIP_SRC_DST} or ip[66:4]==${IPIP_SRC_DST} )"
Sample output:-
tcpdump: listening on eth0, link-type EN10MB (Ethernet), capture size 262144 bytes
09:55:01.804686 IP (tos 0x0, ttl 63, id 6255, offset 0, flags [none], proto UDP (17), length 134)
    172.105.49.152.50998 > 45.79.122.6.8472: [udp sum ok] OTV, flags [I] (0x08), overlay 0, instance 1
IP (tos 0x0, ttl 63, id 41769, offset 0, flags [DF], proto ICMP (1), length 84)
    10.42.1.5 > 10.42.0.10: ICMP echo request, id 97, seq 1, length 64
09:55:01.805191 IP (tos 0x0, ttl 64, id 43038, offset 0, flags [none], proto UDP (17), length 134)
    45.79.122.6.60254 > 172.105.49.152.8472: [bad udp cksum 0x85da -> 0x7b87!] OTV, flags [I] (0x08), overlay 0, instance 1
IP (tos 0x0, ttl 63, id 11811, offset 0, flags [none], proto ICMP (1), length 84)
    10.42.0.10 > 10.42.1.5: ICMP echo reply, id 97, seq 1, length 64
Weave peer connectivity information
docker exec -it $(docker ps -q --filter name=k8s_weave_weave-net) ./weave --local status
docker exec -it $(docker ps -q --filter name=k8s_weave_weave-net) ./weave --local status peers
docker exec -it $(docker ps -q --filter name=k8s_weave_weave-net) ./weave --local status connections
docker exec -it $(docker ps -q --filter name=k8s_weave_weave-net) ./weave --local status ipam
etcd
Using etcdctl with RKE1
etcd 3.5.7 and above
Prerequisite (important) - Set endpoints environment variable
ETCDCTL_ENDPOINTS=$(docker exec etcd etcdctl member list | cut -d, -f5 | sed -e 's/ //g' | paste -sd ',')
Commands
- etcdctl cluster endpoint status
docker exec -e ETCDCTL_ENDPOINTS=$ETCDCTL_ENDPOINTS etcd etcdctl endpoint status --write-out table
- etcdctl endpoint health
docker exec -e ETCDCTL_ENDPOINTS=$ETCDCTL_ENDPOINTS etcd etcdctl endpoint health
- etcdctl perf check
docker exec -e ETCDCTL_ENDPOINTS=$ETCDCTL_ENDPOINTS etcd etcdctl check perf
- etcdctl alarm list
docker exec -e ETCDCTL_ENDPOINTS=$ETCDCTL_ENDPOINTS etcd etcdctl alarm list
- etcd metrics (from all etcd nodes)
KEY=$(find /etc/kubernetes/ssl/ -name "kube-etcd-*-key.pem" | head -n1)
CERT=$(echo $KEY | sed 's/-key//g')
ENDPOINTS=$(docker exec etcd etcdctl member list | cut -d, -f5 | egrep -o '([0-9]{1,3}\.){3}[0-9]{1,3}')
for ENDPOINT in $ENDPOINTS
  do
    curl -L --cacert /etc/kubernetes/ssl/kube-ca.pem --key $KEY --cert $CERT https://$ENDPOINT:2379/metrics >> etcd-metrics-$ENDPOINT.txt
done
- etcd metrics (from a single node)
curl --cacert /etc/kubernetes/ssl/kube-ca.pem --key /etc/kubernetes/ssl/kube-etcd-xxx-key.pem --cert /etc/kubernetes/ssl/kube-etcd-xxx.pem https://127.0.0.1:2379/metrics
etcd 3.5.6 and below
- etcdctl cluster endpoint status
docker exec -e ETCDCTL_ENDPOINTS=$(docker exec etcd /bin/sh -c "etcdctl member list | cut -d, -f5 | sed -e 's/ //g' | paste -sd ','") etcd etcdctl endpoint status --write-out table
- etcdctl endpoint health
docker exec -e ETCDCTL_ENDPOINTS=$(docker exec etcd /bin/sh -c "etcdctl member list | cut -d, -f5 | sed -e 's/ //g' | paste -sd ','") etcd etcdctl endpoint health
- etcdctl perf check
docker exec -e ETCDCTL_ENDPOINTS=$(docker exec etcd /bin/sh -c "etcdctl member list | cut -d, -f5 | sed -e 's/ //g' | paste -sd ','") etcd etcdctl check perf
- etcdctl alarm list
docker exec -e ETCDCTL_ENDPOINTS=$(docker exec etcd /bin/sh -c "etcdctl member list | cut -d, -f5 | sed -e 's/ //g' | paste -sd ','") etcd etcdctl alarm list
- etcd metrics (from all etcd nodes)
KEY=$(find /etc/kubernetes/ssl/ -name "kube-etcd-*-key.pem" | head -n1)
CERT=$(echo $KEY | sed 's/-key//g')
for ENDPOINT in $(docker exec etcd /bin/sh -c "etcdctl member list" | cut -d, -f5 | egrep -o '([0-9]{1,3}\.){3}[0-9]{1,3}')
  do
    curl -L --cacert /etc/kubernetes/ssl/kube-ca.pem --key $KEY --cert $CERT https://$ENDPOINT:2379/metrics >> etcd-metrics-$ENDPOINT.txt
done
- etcd metrics (from a single node)
curl --cacert /etc/kubernetes/ssl/kube-ca.pem --key /etc/kubernetes/ssl/kube-etcd-xxx-key.pem --cert /etc/kubernetes/ssl/kube-etcd-xxx.pem https://127.0.0.1:2379/metrics
Working with etcd in RKE2
Using crictl
Newer distroless (RKE2 ~>v1.28) container
Prework (important)
export CRI_CONFIG_FILE=/var/lib/rancher/rke2/agent/etc/crictl.yaml
PATH="$PATH:/var/lib/rancher/rke2/bin"

etcdcontainer=$(/var/lib/rancher/rke2/bin/crictl ps --label io.kubernetes.container.name=etcd --quiet)
ETCD_CERT=/var/lib/rancher/rke2/server/tls/etcd/server-client.crt
ETCD_KEY=/var/lib/rancher/rke2/server/tls/etcd/server-client.key
ETCD_CACERT=/var/lib/rancher/rke2/server/tls/etcd/server-ca.crt
ETCDCTL_ENDPOINTS=$(crictl exec ${etcdcontainer} etcdctl --cert ${ETCD_CERT} --key ${ETCD_KEY} --cacert ${ETCD_CACERT} member list | cut -d, -f5 | sed -e 's/ //g' | paste -sd ',')
- etcdctl check perf
crictl exec ${etcdcontainer} etcdctl --cert ${ETCD_CERT} --key ${ETCD_KEY} --cacert ${ETCD_CACERT} --endpoints=$ETCDCTL_ENDPOINTS check perf
- etcdctl member list
crictl exec ${etcdcontainer} etcdctl --cert ${ETCD_CERT} --key ${ETCD_KEY} --cacert ${ETCD_CACERT} --endpoints=$ETCDCTL_ENDPOINTS --write-out table member list
- etcdctl endpoint status
crictl exec ${etcdcontainer} etcdctl --cert ${ETCD_CERT} --key ${ETCD_KEY} --cacert ${ETCD_CACERT} --endpoints=$ETCDCTL_ENDPOINTS endpoint status --write-out=table
- etcdctl endpoint health
crictl exec ${etcdcontainer} etcdctl --cert ${ETCD_CERT} --key ${ETCD_KEY} --cacert ${ETCD_CACERT} --endpoints=$ETCDCTL_ENDPOINTS endpoint health
- etcdctl compact
rev=$(crictl exec ${etcdcontainer} etcdctl --cert ${ETCD_CERT} --key ${ETCD_KEY} --cacert ${ETCD_CACERT} endpoint status --write-out fields | grep Revision | cut -d: -f2)

crictl exec ${etcdcontainer} etcdctl --cert ${ETCD_CERT} --key ${ETCD_KEY} --cacert ${ETCD_CACERT} compact $rev
- etcdctl defrag
crictl exec ${etcdcontainer} etcdctl --cert ${ETCD_CERT} --key ${ETCD_KEY} --cacert ${ETCD_CACERT} defrag --cluster
- etcdctl alarm list
crictl exec ${etcdcontainer} etcdctl --cert ${ETCD_CERT} --key ${ETCD_KEY} --cacert ${ETCD_CACERT} --endpoints=$ETCDCTL_ENDPOINTS alarm list
Older etcd container images
Prework (important)
Set these environment vars to be able to run the below
crictl commands:export CRI_CONFIG_FILE=/var/lib/rancher/rke2/agent/etc/crictl.yaml
PATH="$PATH:/var/lib/rancher/rke2/bin"
etcdcontainer=$(/var/lib/rancher/rke2/bin/crictl ps --label io.kubernetes.container.name=etcd --quiet)
- etcdctl check perf
crictl exec $etcdcontainer sh -c "ETCDCTL_CACERT='/var/lib/rancher/rke2/server/tls/etcd/server-ca.crt' ETCDCTL_CERT='/var/lib/rancher/rke2/server/tls/etcd/server-client.crt' ETCDCTL_KEY='/var/lib/rancher/rke2/server/tls/etcd/server-client.key' ETCDCTL_API=3 etcdctl check perf"
- etcdctl member list
crictl exec $etcdcontainer sh -c "ETCDCTL_CACERT='/var/lib/rancher/rke2/server/tls/etcd/server-ca.crt' ETCDCTL_CERT='/var/lib/rancher/rke2/server/tls/etcd/server-client.crt' ETCDCTL_KEY='/var/lib/rancher/rke2/server/tls/etcd/server-client.key' ETCDCTL_API=3 etcdctl --write-out table member list"
- etcdctl endpoint status
crictl exec $etcdcontainer sh -c "ETCDCTL_ENDPOINTS=$(crictl exec $etcdcontainer sh -c "ETCDCTL_CACERT='/var/lib/rancher/rke2/server/tls/etcd/server-ca.crt' ETCDCTL_CERT='/var/lib/rancher/rke2/server/tls/etcd/server-client.crt' ETCDCTL_KEY='/var/lib/rancher/rke2/server/tls/etcd/server-client.key' ETCDCTL_API=3 etcdctl member list | cut -d, -f5 | sed -e 's/ //g' | paste -sd ','") ETCDCTL_CACERT='/var/lib/rancher/rke2/server/tls/etcd/server-ca.crt' ETCDCTL_CERT='/var/lib/rancher/rke2/server/tls/etcd/server-client.crt' ETCDCTL_KEY='/var/lib/rancher/rke2/server/tls/etcd/server-client.key' ETCDCTL_API=3 etcdctl endpoint status --write-out=table"
- etcdctl endpoint health
crictl exec $etcdcontainer sh -c "ETCDCTL_ENDPOINTS=$(crictl exec $etcdcontainer sh -c "ETCDCTL_CACERT='/var/lib/rancher/rke2/server/tls/etcd/server-ca.crt' ETCDCTL_CERT='/var/lib/rancher/rke2/server/tls/etcd/server-client.crt' ETCDCTL_KEY='/var/lib/rancher/rke2/server/tls/etcd/server-client.key' ETCDCTL_API=3 etcdctl member list | cut -d, -f5 | sed -e 's/ //g' | paste -sd ','") ETCDCTL_CACERT='/var/lib/rancher/rke2/server/tls/etcd/server-ca.crt' ETCDCTL_CERT='/var/lib/rancher/rke2/server/tls/etcd/server-client.crt' ETCDCTL_KEY='/var/lib/rancher/rke2/server/tls/etcd/server-client.key' ETCDCTL_API=3 etcdctl endpoint health --write-out=table"
- etcdctl compact
rev=$(crictl exec $etcdcontainer sh -c "ETCDCTL_CACERT='/var/lib/rancher/rke2/server/tls/etcd/server-ca.crt' ETCDCTL_CERT='/var/lib/rancher/rke2/server/tls/etcd/server-client.crt' ETCDCTL_KEY='/var/lib/rancher/rke2/server/tls/etcd/server-client.key' ETCDCTL_API=3 etcdctl endpoint status --write-out fields | grep Revision | cut -d: -f2")

crictl exec $etcdcontainer sh -c "ETCDCTL_CACERT='/var/lib/rancher/rke2/server/tls/etcd/server-ca.crt' ETCDCTL_CERT='/var/lib/rancher/rke2/server/tls/etcd/server-client.crt' ETCDCTL_KEY='/var/lib/rancher/rke2/server/tls/etcd/server-client.key' ETCDCTL_API=3 etcdctl compact $rev"
- etcdctl defrag
crictl exec $etcdcontainer sh -c "ETCDCTL_CACERT='/var/lib/rancher/rke2/server/tls/etcd/server-ca.crt' ETCDCTL_CERT='/var/lib/rancher/rke2/server/tls/etcd/server-client.crt' ETCDCTL_KEY='/var/lib/rancher/rke2/server/tls/etcd/server-client.key' ETCDCTL_API=3 etcdctl defrag --cluster"
- etcdctl alarm list
crictl exec $etcdcontainer sh -c "ETCDCTL_CACERT='/var/lib/rancher/rke2/server/tls/etcd/server-ca.crt' ETCDCTL_CERT='/var/lib/rancher/rke2/server/tls/etcd/server-client.crt' ETCDCTL_KEY='/var/lib/rancher/rke2/server/tls/etcd/server-client.key' ETCDCTL_API=3 etcdctl alarm list"
- etcd metrics with curl
curl -L --cacert /var/lib/rancher/rke2/server/tls/etcd/server-ca.crt --cert /var/lib/rancher/rke2/server/tls/etcd/server-client.crt --key /var/lib/rancher/rke2/server/tls/etcd/server-client.key https://127.0.0.1:2379/metrics
wal_fsync_duration_seconds< 10ms = GOOD - preferrably well belowbackend_commit_duration_seconds< 25ms = GOOD
wal_fsync_duration_seconds is latency etcd persistenting log entries to the disk, before applying it. After every write call, it's doing an fsync call to confirm data is written to disk - not in kernel memory etc.backend_commit_duration_seconds etcd commits an incremental snapshot of it's most recent snapshot to disk.- Logs from etcd (RKE2)
/var/lib/rancher/rke2/bin/crictl logs $etcdcontainer |& gzip > etcd.log.gz
Using kubectl
Prework (important)
Set a kubeconfig file for the cluster, if needed use the kubeconfig on an rke2-server node
export KUBECONFIG=/etc/rancher/rke2/rke2.yaml
Commands:
- etcdctl check perf
for etcdpod in $(kubectl -n kube-system get pod -l component=etcd --no-headers -o custom-columns=NAME:.metadata.name); do kubectl -n kube-system exec $etcdpod -- sh -c "ETCDCTL_ENDPOINTS='https://127.0.0.1:2379' ETCDCTL_CACERT='/var/lib/rancher/rke2/server/tls/etcd/server-ca.crt' ETCDCTL_CERT='/var/lib/rancher/rke2/server/tls/etcd/server-client.crt' ETCDCTL_KEY='/var/lib/rancher/rke2/server/tls/etcd/server-client.key' ETCDCTL_API=3 etcdctl check perf"; done
- etcdctl endpoint status
for etcdpod in $(kubectl -n kube-system get pod -l component=etcd --no-headers -o custom-columns=NAME:.metadata.name); do kubectl -n kube-system exec $etcdpod -- sh -c "ETCDCTL_ENDPOINTS='https://127.0.0.1:2379' ETCDCTL_CACERT='/var/lib/rancher/rke2/server/tls/etcd/server-ca.crt' ETCDCTL_CERT='/var/lib/rancher/rke2/server/tls/etcd/server-client.crt' ETCDCTL_KEY='/var/lib/rancher/rke2/server/tls/etcd/server-client.key' ETCDCTL_API=3 etcdctl endpoint status"; done
- etcdctl endpoint health
for etcdpod in $(kubectl -n kube-system get pod -l component=etcd --no-headers -o custom-columns=NAME:.metadata.name); do kubectl -n kube-system exec $etcdpod -- sh -c "ETCDCTL_ENDPOINTS='https://127.0.0.1:2379' ETCDCTL_CACERT='/var/lib/rancher/rke2/server/tls/etcd/server-ca.crt' ETCDCTL_CERT='/var/lib/rancher/rke2/server/tls/etcd/server-client.crt' ETCDCTL_KEY='/var/lib/rancher/rke2/server/tls/etcd/server-client.key' ETCDCTL_API=3 etcdctl endpoint health"; done
- etcdctl alarm list
for etcdpod in $(kubectl -n kube-system get pod -l component=etcd --no-headers -o custom-columns=NAME:.metadata.name); do kubectl -n kube-system exec $etcdpod -- sh -c "ETCDCTL_ENDPOINTS='https://127.0.0.1:2379' ETCDCTL_CACERT='/var/lib/rancher/rke2/server/tls/etcd/server-ca.crt' ETCDCTL_CERT='/var/lib/rancher/rke2/server/tls/etcd/server-client.crt' ETCDCTL_KEY='/var/lib/rancher/rke2/server/tls/etcd/server-client.key' ETCDCTL_API=3 etcdctl alarm list"; done
- etcdctl compact
rev=$(kubectl -n kube-system exec $(kubectl -n kube-system get pod -l component=etcd --no-headers -o custom-columns=NAME:.metadata.name | head -1) -- sh -c "ETCDCTL_ENDPOINTS='https://127.0.0.1:2379' ETCDCTL_CACERT='/var/lib/rancher/rke2/server/tls/etcd/server-ca.crt' ETCDCTL_CERT='/var/lib/rancher/rke2/server/tls/etcd/server-client.crt' ETCDCTL_KEY='/var/lib/rancher/rke2/server/tls/etcd/server-client.key' ETCDCTL_API=3 etcdctl endpoint status --write-out fields | grep Revision | cut -d: -f2")
kubectl -n kube-system exec $(kubectl -n kube-system get pod -l component=etcd --no-headers -o custom-columns=NAME:.metadata.name | head -1) -- sh -c "ETCDCTL_ENDPOINTS='https://127.0.0.1:2379' ETCDCTL_CACERT='/var/lib/rancher/rke2/server/tls/etcd/server-ca.crt' ETCDCTL_CERT='/var/lib/rancher/rke2/server/tls/etcd/server-client.crt' ETCDCTL_KEY='/var/lib/rancher/rke2/server/tls/etcd/server-client.key' ETCDCTL_API=3 etcdctl compact \"$(echo $rev)\""
- etcdctl defrag
kubectl -n kube-system exec $(kubectl -n kube-system get pod -l component=etcd --no-headers -o custom-columns=NAME:.metadata.name | head -1) -- sh -c "ETCDCTL_ENDPOINTS='https://127.0.0.1:2379' ETCDCTL_CACERT='/var/lib/rancher/rke2/server/tls/etcd/server-ca.crt' ETCDCTL_CERT='/var/lib/rancher/rke2/server/tls/etcd/server-client.crt' ETCDCTL_KEY='/var/lib/rancher/rke2/server/tls/etcd/server-client.key' ETCDCTL_API=3 etcdctl defrag --cluster"
etcd raw metrics
The below retrieves the metrics from the first etcd pod listed by kubectl in the cluster
kubectl -n kube-system exec $(kubectl -n kube-system get pod -l component=etcd --no-headers -o custom-columns=NAME:.metadata.name | head -1) -- sh -c "curl -L --cacert /var/lib/rancher/rke2/server/tls/etcd/server-ca.crt --cert /var/lib/rancher/rke2/server/tls/etcd/server-client.crt --key /var/lib/rancher/rke2/server/tls/etcd/server-client.key -s https://127.0.0.1:2379/metrics"
wal_fsync_duration_seconds< 10ms = GOOD - preferrably well belowbackend_commit_duration_seconds< 25ms = GOOD
wal_fsync_duration_seconds is latency etcd persistenting log entries to the disk, before applying it. After every write call, it's doing an fsync call to confirm data is written to disk - not in kernel memory etc.backend_commit_duration_seconds etcd commits an incremental snapshot of it's most recent snapshot to disk.Set etcd log level DEBUG/INFO (RKE1)
DEBUG
docker run --net=host -v $(docker inspect kubelet --format '{{ range .Mounts }}{{ if eq .Destination "/etc/kubernetes" }}{{ .Source }}{{ end }}{{ end }}')/ssl:/etc/kubernetes/ssl:ro appropriate/curl -s -XPUT -d '{"Level":"DEBUG"}' --cacert $(docker exec etcd printenv ETCDCTL_CACERT) --cert $(docker exec etcd printenv ETCDCTL_CERT) --key $(docker exec etcd printenv ETCDCTL_KEY) $(docker exec etcd printenv ETCDCTL_ENDPOINTS)/config/local/log
INFO
docker run --net=host -v $(docker inspect kubelet --format '{{ range .Mounts }}{{ if eq .Destination "/etc/kubernetes" }}{{ .Source }}{{ end }}{{ end }}')/ssl:/etc/kubernetes/ssl:ro appropriate/curl -s -XPUT -d '{"Level":"INFO"}' --cacert $(docker exec etcd printenv ETCDCTL_CACERT) --cert $(docker exec etcd printenv ETCDCTL_CERT) --key $(docker exec etcd printenv ETCDCTL_KEY) $(docker exec etcd printenv ETCDCTL_ENDPOINTS)/config/local/log
Object count (RKE1)
docker exec etcd etcdctl get /registry --prefix=true --keys-only | grep -v ^$ | awk -F'/' '{ if ($3 ~ /cattle.io/) {h[$3"/"$4]++} else { h[$3]++ }} END { for(k in h) print h[k], k }' | sort -n > etcd-count-objecttype.txt
Object count (RKE2)
##### Pre-work
export CRI_CONFIG_FILE=/var/lib/rancher/rke2/agent/etc/crictl.yaml
etcdcontainer=$(/var/lib/rancher/rke2/bin/crictl ps --label io.kubernetes.container.name=etcd --quiet)
ETCD_CERT=/var/lib/rancher/rke2/server/tls/etcd/server-client.crt
ETCD_KEY=/var/lib/rancher/rke2/server/tls/etcd/server-client.key
ETCD_CACERT=/var/lib/rancher/rke2/server/tls/etcd/server-ca.crt

##### Count objects
crictl exec ${etcdcontainer} etcdctl --cert ${ETCD_CERT} --key ${ETCD_KEY} --cacert ${ETCD_CACERT} get /registry --prefix=true --keys-only | grep -v ^$ | awk -F'/' '{ if ($3 ~ /cattle.io/) {h[$3"/"$4]++} else { h[$3]++ }} END { for(k in h) print h[k], k }' | sort -n > etcd-count-objecttype.txt
Object count (RKE2) !! Older etcd images
##### Pre-work
export CRI_CONFIG_FILE=/var/lib/rancher/rke2/agent/etc/crictl.yaml
etcdcontainer=$(/var/lib/rancher/rke2/bin/crictl ps --label io.kubernetes.container.name=etcd --quiet)

##### Count objects
/var/lib/rancher/rke2/bin/crictl exec $etcdcontainer sh -c "ETCDCTL_ENDPOINTS='https://127.0.0.1:2379' ETCDCTL_CACERT='/var/lib/rancher/rke2/server/tls/etcd/server-ca.crt' ETCDCTL_CERT='/var/lib/rancher/rke2/server/tls/etcd/server-client.crt' ETCDCTL_KEY='/var/lib/rancher/rke2/server/tls/etcd/server-client.key' ETCDCTL_API=3 etcdctl get /registry --prefix=true --keys-only" | grep -v ^$ | awk -F'/' '{ if ($3 ~ /cattle.io/) {h[$3"/"$4]++} else { h[$3]++ }} END { for(k in h) print h[k], k }' | sort -n > etcd-count-objecttype.txt
Object count (postgres - K3S)
SELECT * FROM ( SELECT count( 1 ) num, NAME FROM kine GROUP BY kine.name ) ab ORDER BY num DESC;
Object sizes (can take time...)
Note: this method counts the object sizes with:total size = current size * count #. This is not strictly accurate, but a decent indicator of size. Revisions can deviate in size over time (like adding/removing data in a ConfigMap). Counting every revision individually is probably not desired on large or production clusters, so this method of counting the total size based on the current object size is used. More info here if collecting each revision is needed, this may be best run on a snapshot restore to a temporary cluster
Prework
RKE1
- Exec into the etcd container to use the etcdctl commands below to gather object sizes
docker exec -it etcd sh
RKE2
- Download
etcdctlto an etcd node in the cluster - Note: replace
ETCD_VERas needed to closely match the version in use on the cluster
ETCD_VER=v3.5.21
DOWNLOAD_URL=https://storage.googleapis.com/etcd

curl -L ${DOWNLOAD_URL}/${ETCD_VER}/etcd-${ETCD_VER}-linux-amd64.tar.gz -o /tmp/etcd-${ETCD_VER}-linux-amd64.tar.gz
tar xzvf /tmp/etcd-${ETCD_VER}-linux-amd64.tar.gz -C /usr/local/bin --strip-components=1 --no-same-owner
rm -f /tmp/etcd-${ETCD_VER}-linux-amd64.tar.gz

/usr/local/bin/etcdctl version
- Export the necessary environment vars for use in the
etcdctlcommands below
export ETCDCTL_ENDPOINTS='https://127.0.0.1:2379/' ETCDCTL_CACERT='/var/lib/rancher/rke2/server/tls/etcd/server-ca.crt' ETCDCTL_CERT='/var/lib/rancher/rke2/server/tls/etcd/server-client.crt' ETCDCTL_KEY='/var/lib/rancher/rke2/server/tls/etcd/server-client.key' ETCDCTL_API=3
Count all objects
for key in `etcdctl get --prefix --keys-only /`
do
  size=`etcdctl get $key --print-value-only | wc -c`
  count=`etcdctl get $key --write-out=fields | grep \"Count\" | cut -f2 -d':'`
  if [ $count -ne 0 ]; then
    versions=`etcdctl get $key --write-out=fields | grep \"Version\" | cut -f2 -d':'`
  else
    versions=0
  fi
  total=$(($size * $versions))
  echo $total $size $versions $count $key >> /tmp/etcdkeys.txt
done
Optional: only specific object, eg: secrets
for key in `etcdctl get --prefix --keys-only /registry/secrets`
do
  size=`etcdctl get $key --print-value-only | wc -c`
  count=`etcdctl get $key --write-out=fields | grep \"Count\" | cut -f2 -d':'`
  if [ $count -ne 0 ]; then
    versions=`etcdctl get $key --write-out=fields | grep \"Version\" | cut -f2 -d':'`
  else
    versions=0
  fi
  total=$(($size * $versions))
  echo $total $size $versions $count $key >> /tmp/etcdkeys-secrets.txt
done
- Sort the output
sort -n /tmp/etcdkeys.txt
- Copy the file if needed (RKE1 only)
docker cp etcd:/tmp/etcdkeys.txt .
Manual compaction on Postgres
For k3s clusters, a manual compaction has been run before
DELETE FROM kine AS kv
USING	(
  SELECT kp.prev_revision AS id
  FROM kine AS kp
  WHERE
    kp.name != 'compact_rev_key' AND
    kp.prev_revision != 0 AND
    kp.id <= $1
  UNION
  SELECT kd.id AS id
  FROM kine AS kd
  WHERE
    kd.deleted != 0 AND
    kd.id <= $2
) AS ks
WHERE kv.id = ks.id
Replace $1 and 2 with the ID that compaction should be limited to, usually the last record ID in the DB minus 2k-5k for safety.
To get the last record, something like this should work, please check:
SELECT * FROM kine ORDER BY CREATED_TIME DESC LIMIT 1Grab all high kube-apiserver/etcd request times
These examples use >=1s (1000ms) as the filter, adjust the regex
[1-9][0-9]{3,}.+ms to a higher number, for eg [2-9][0-9]{3,}.+ms for >=2s.Or, for higher than 10s add another digit:
[1-9][0-9]{4,}.+mskube-apiserver
grep -hE '(total time:.[1-9][0-9]{3,}.+ms)' <log directory>/k8s/containerlogs/kube-apiserver

##### Or while tailing the container logs

docker logs -f --tail=1000 kube-apiserver |& grep -E '(total time:.[1-9][0-9]{3,}.+ms)'
To gather the worst timestamps for occurances
grep -hE '(total time:.[1-9][0-9]{3,}.+ms)' <log directory>/k8s/containerlogs/kube-apiserver | cut -d. -f1 | sort | uniq -c | sort -r | head -20
etcd
grep -hE 'took too long (.[1-9][0-9]{3,}.+ms)' <log directory>/k8s/containerlogs/etcd

##### Or while tailing the container logs

docker logs -f --tail=1000 etcd |& grep -E 'took too long (.[1-9][0-9]{3,}.+ms)'
Test connectivity to all etcd members (RKE1)
for endpoint in $(docker exec etcd /bin/sh -c "etcdctl member list | cut -d, -f5"); do
   echo "Validating connection to ${endpoint}/health"
   docker run --net=host -v $(docker inspect kubelet --format '{{ range .Mounts }}{{ if eq .Destination "/etc/kubernetes" }}{{ .Source }}{{ end }}{{ end }}')/ssl:/etc/kubernetes/ssl:ro appropriate/curl -s -w "\n" --cacert $(docker exec etcd printenv ETCDCTL_CACERT) --cert $(docker exec etcd printenv ETCDCTL_CERT) --key $(docker exec etcd printenv ETCDCTL_KEY) "${endpoint}/health"
done

for endpoint in $(docker exec etcd /bin/sh -c "etcdctl member list | cut -d, -f4"); do
  echo "Validating connection to ${endpoint}/version";
  docker run --net=host -v $(docker inspect kubelet --format '{{ range .Mounts }}{{ if eq .Destination "/etc/kubernetes" }}{{ .Source }}{{ end }}{{ end }}')/ssl:/etc/kubernetes/ssl:ro appropriate/curl --http1.1 -s -w "\n" --cacert $(docker exec etcd printenv ETCDCTL_CACERT) --cert $(docker exec etcd printenv ETCDCTL_CERT) --key $(docker exec etcd printenv ETCDCTL_KEY) "${endpoint}/version"
done
SSL / Certs
Check remote cert
openssl s_client -showcerts -connect <server-name>:443 -servername <server-name>
Connect over TLS
openssl s_client -connect <ip-address>:6443
Check certs
| Check | Command |
|---|---|
| Inspect | openssl x509 -in <cert-path> -noout -text |
| Expiration | openssl x509 -startdate -enddate -noout -in <cert-path> |
| Expiration for components | for cert in $(ls -d /etc/kubernetes/ssl/* | grep -v key | grep pem); do echo $cert; openssl x509 -startdate -enddate -noout -in $cert; done |
| Verify cert signed by CA | openssl verify -verbose -CAfile <ca-cert-path> <cert-path> |
| Verify cert signed by CA & Intermeditate | openssl verify -CAfile <ca-cert-path> -untrusted <intermediate-cert-path> <cert-path> |
| Verify cert matches it's key | openssl x509 -noout -modulus -in <cert-path> | openssl md5 and openssl rsa -noout -modulus -in <key-path> | openssl md5 |
Check RKE2 certificate files for expiry
- Agent
for CERT in $(find /var/lib/rancher/rke2/agent/*.crt); do echo $CERT; openssl x509 -text -noout -in $CERT | grep "Not "; done
- Server
for CERT in $(find /var/lib/rancher/rke2/server/tls -type f -name *.crt); do echo $CERT; openssl x509 -text -noout -in $CERT | grep "Not "; done
Create self signed certs quickly
DOMAIN=test.example.com
docker run -v $(pwd):/certs -e SSL_SUBJECT=${DOMAIN} -e SSL_DNS=${DOMAIN} paulczar/omgwtfssl
Increase the cert/CA expiry
DOMAIN=1.2.3.4.nip.io
docker run -v $(pwd)/certs:/certs -e SSL_SUBJECT=${DOMAIN} -e SSL_DNS=${DOMAIN} -e SSL_EXPIRE=1000 -e CA_EXPIRE=1000 paulczar/omgwtfssl
Start k3s cluster on docker container without Rancher
Stop the existing container
docker stop rancher
Start a new one with the bash shell
docker run it -v /opt/rancher:/var/lib/rancher privileged --entrypoint /bin/bash rancher/rancher:v2.5.5
Start etcd & k3s inside the container
nohup etcd --data-dir=management-state/etcd --heartbeat-interval=500 --election-timeout=5000 &
nohup k3s server --no-deploy=traefik --no-deploy=servicelb --no-deploy=metrics-server --no-deploy=local-storage --node-name=local-node --datastore-endpoint=http://localhost:2379 &
Verify the cluster with "kubectl get nodes."
Monitoring
Heap from Prometheus (monitoring v2)
kubectl run -it --image=golang --restart=Never --rm go-tools -- go tool pprof -symbolize=remote -inuse_space http://rancher-monitoring-prometheus.cattle-monitoring-system.svc.cluster.local:9090/debug/pprof/heap
At the
(pprof) prompt, type top:(pprof) top
Showing nodes accounting for 507.88MB, 73.40% of 691.95MB total
Dropped 181 nodes (cum <= 3.46MB)
Showing top 10 nodes out of 102
flat flat% sum% cum cum%
143.21MB 20.70% 20.70% 157.71MB 22.79% github.com/prometheus/prometheus/tsdb.(*blockBaseSeriesSet).Next
90.05MB 13.01% 33.71% 90.05MB 13.01% github.com/prometheus/prometheus/pkg/labels.(*Builder).Labels
51.50MB 7.44% 41.15% 51.50MB 7.44% github.com/prometheus/prometheus/tsdb/encoding.(*Decbuf).UvarintStr (inline)
47.52MB 6.87% 48.02% 84.02MB 12.14% github.com/prometheus/prometheus/tsdb/record.(*Decoder).Series
42.41MB 6.13% 54.15% 42.41MB 6.13% github.com/prometheus/prometheus/scrape.newScrapePool.func1
32.51MB 4.70% 58.85% 41.51MB 6.00% github.com/prometheus/prometheus/tsdb.newMemSeries
29.05MB 4.20% 63.04% 29.05MB 4.20% github.com/prometheus/prometheus/tsdb.seriesHashmap.set
28.51MB 4.12% 67.16% 28.51MB 4.12% github.com/prometheus/prometheus/pkg/textparse.(*PromParser).Metric
22.50MB 3.25% 70.42% 22.50MB 3.25% github.com/prometheus/prometheus/tsdb/chunkenc.NewXORChunk
20.63MB 2.98% 73.40% 20.63MB 2.98% github.com/prometheus/prometheus/scrape.(*scrapeCache).addRef
(pprof)
Prometheus queries
API server 4xx/5xx requests
sum(rate(apiserver_request_total{code=~"[45].."}[2m]))
All API server requests
sum(rate(apiserver_request_total[2m]))
Delete cluster-monitoring apprevision history
PROJECT=<project-id>

for i in  $(kubectl get apprevisions.project.cattle.io -n ${PROJECT} -o custom-columns=Apps:'{.metadata.labels.io\.cattle\.field/appId}',Projects:.spec.projectName,Name:.metadata.name,ResourceVersion:.metadata.resourceVersion --sort-by=.metadata.resourceVersion | grep cluster-monitoring | head -n -10 | awk '{print $3}'); do kubectl delete apprevisions $i -n ${PROJECT}; done
Disable V1 Monitoring
Run this with kubectl pointed to the local Rancher cluster
for clusterId in $(kubectl get clusters.management.cattle.io -o jsonpath='{range .items[*]}{.metadata.name}{"\n"}{end}');
do
  # empty recipients for cluster alert groups
  for clusterAlertGroup in $(kubectl -n $clusterId get clusteralertgroups -o jsonpath='{range .items[*]}{.metadata.name}{"\n"}{end}');
  do
    kubectl -n $clusterId patch clusteralertgroup $clusterAlertGroup --type merge --patch '{"spec": {"recipients": []}}'
  done

  # disable cluster monitoring
  kubectl patch clusters.management.cattle.io $clusterId --type merge --patch '{"spec": {"enableClusterMonitoring": false}}'

  for projectId in $(kubectl -n $clusterId get projects.management.cattle.io -o jsonpath='{range .items[*]}{.metadata.name}{"\n"}{end}')
  do
    # empty recipients for all project alert groups
    for projectalertgroup in $(kubectl -n $projectId get projectalertgroups -o jsonpath='{range .items[*]}{.metadata.name}{"\n"}{end}');
    do
      kubectl -n $projectId patch projectalertgroup $projectalertgroup --type merge --patch '{"spec": {"recipients": []}}'
    done

    # disable project monitoring
    kubectl -n $clusterId patch projects.management.cattle.io $projectId --type merge --patch '{"spec": {"enableProjectMonitoring:": false}}'

    # delete the project monitoring app
    kubectl -n $projectId delete apps.project.cattle.io cluster-monitoring monitoring-operator project-monitoring

    # clean apprevisions for cleanliness
    kubectl -n $projectId delete apprevisions -l io.cattle.field/appId=monitoring-operator
    kubectl -n $projectId delete apprevisions -l io.cattle.field/appId=cluster-monitoring
    kubectl -n $projectId delete apprevisions  -l io.cattle.field/appId=project-monitoring
  done
done
Logging
Fluentd pod logs
kubectl exec -n cattle-logging-system rancher-logging-fluentd-0 -c fluentd cat /fluentd/log/out &> fluentd.log
Note: On newer rancher-logging versions the StatefulSet name changed to
rancher-logging-root-fluentd-0:kubectl exec -n cattle-logging-system rancher-logging-root-fluentd-0 -c fluentd cat /fluentd/log/out &> fluentd.log
Fleet
Quick collection of fleet output for troubleshooting
On the Rancher (local) management cluster:
kubectl logs -l app=fleet-agent -n cattle-fleet-local-system --tail=-1 &> local-fleet-agent.log
kubectl logs -l app=fleet-controller -n cattle-fleet-system --tail=-1 &> local-fleet-controller.log
kubectl logs -l app=gitjob -n cattle-fleet-system --tail=-1 &> local-fleet-gitjob.log
kubectl get gitrepo -A -o jsonpath='{range .items[*]}{@.metadata.name}{" - "}{@.metadata.namespace}{":\n "}{@.status}{"\n"}{end}' &> gitrepo-status.log
kubectl get bundle -A -o jsonpath='{range .items[*]}{@.metadata.name}{" - "}{@.metadata.namespace}{":\n "}{@.status}{"\n"}{end}' &> bundle-status.log

for pod in $(kubectl get pods -n fleet-default -l job-name --no-headers -o custom-columns=":metadata.name")
  do
    kubectl logs -n fleet-default $pod -c step-git-source &> $pod.log
done

for pod in $(kubectl get pods -n fleet-local -l job-name --no-headers -o custom-columns=":metadata.name")
  do
    kubectl logs -n fleet-local $pod -c step-git-source &> $pod.log
done
On the downstream cluster
kubectl logs -n cattle-fleet-system -l app=fleet-agent --tail=-1 &> downstream-fleet-agent.log
Return the status of a Bundle.
See example below, run against the local Rancher cluster where "fleet-local" is the name of the workspace and "appcd-local-local-stuff" is the specific bundle to return the status. An alternative to the status in the UI.
kubectl get bundle -n fleet-local appcd-local-local-stuff -o jsonpath='{.status.summary}'
{"desiredReady":1,"ready":1}
Tools
Working with device streams
Container logs often contain both stdout/stderr, this can be annoying to pipe or redirect.
The
|& and &> are a convenient short hand for this:docker logs kubelet --tail=5000 |& less
docker logs kubelet --tail=5000 &> kubelet.log
Bonus tip:
docker logs kubelet |& less -Ip CrashLoop
Starts
less at the first occurrence of a pattern (-p), ignoring case (-I).lnav
Advanced log viewing
Notes
Issues involving multiple components or HA systems spread across many nodes (like the CNI) one can gather logs from ALL nodes, then open ALL logs for related components in one session of
lnav.This will put everything into one indexed view that you can easily navigate in time order. You can start filtering logs out lines or types of entries (matched by regex) as you determine them to be unrelated or benign, and then view histograms and compare to timelines of events to determine what entries may be related to the issue you are investigating.
lnav can handle multiple files/directories at once and will unzip files as needed, for eg
lnav messages*In OS X, download the official release, there may be some bugs in the
brew packaged versionShortcuts
| Key | Description |
|---|---|
/ | Search, use n and N to hit next/previous result |
Tab | Use i and o to add filters to include/exclude strings |
m | Mark lines for future |
M | Mark all lines from a previous mark |
c | Copy marked lines to clipboard, use C to clear all marked lines |
i | A histogram of detected errors/warnings, use z and Z to zoom in/out |
d/D | Move forward/backward by one day at a time |
e/E | Move forward/backward by one detected error at a time |
Ctrl+w | Wrap lines |
| Left/right keys | Move horizontally in the log file |
:write-to <file> | Write marked lines to a file |
Sign certificates quickly - omgwtfssl
DOMAIN=test.example.com
docker run -v $(pwd):/certs -e SSL_SUBJECT=${DOMAIN} -e SSL_DNS=${DOMAIN} paulczar/omgwtfssl
DOMAIN=1.2.3.4.nip.io
docker run -v $(pwd)/certs:/certs -e SSL_SUBJECT=${DOMAIN} -e SSL_DNS=${DOMAIN} -e SSL_EXPIRE=1000 -e CA_EXPIRE=1000 paulczar/omgwtfssl
Using kubectl to print the certs to stdout
DOMAIN=1.2.3.4.nip.io
kubectl run -it --rm --restart=Never --image paulczar/omgwtfssl --env "SSL_SUBJECT=${DOMAIN}" --env "SSL_DNS=${DOMAIN}" --env "SSL_EXPIRE=1000" --env "CA_EXPIRE=1000" omgwtfssl
Note be sure to use
SSL_DNS so that a SAN is added when signingaudit2rbac
Build RBAC from a users activity in audit logs
audit2rbac -f audit-log.json --user u-nuqq4ahpje > audit-policy.yaml
explainshell.com
Regulex
mycurl
mycurl can be useful to get statistics of an HTTP(s) endpoint over time
git clone https://github.com/wiehahne/mycurl
bash mycurl.sh https://rancher.com
lssh
lssh is a cool shell function to simplify ssh'ing to nodes by automatically extracting ssh keys downloaded from Rancher and utilizing your clipboard.
To use:
- Download ssh keys for a node from Rancher
- Copy the nodes IP address to your clipboard
- Run
lssh. To specify a user other thanubuntu, uselssh <node IP> <username>
macOS
function lssh {
  PROSSH_FILE=$(ls -t ~/Downloads | grep ".zip" | head -n1)
  if echo $PROSSH_FILE | grep "(" >/dev/null 2>&1
    then
      DIR=`echo $PROSSH_FILE | cut -d\( -f1 | cut -d' ' -f1`
    else
      DIR=`echo $PROSSH_FILE | cut -d. -f1`
  fi
  PROSSH_USER=$2
  PROSSH_IP=$1
  if [ -z "${PROSSH_USER}" ]; then
    PROSSH_USER='ubuntu'
  fi
  if [ -z "${PROSSH_IP}" ]; then
    PROSSH_IP=$(pbpaste)
  fi
  unzip -p ~/Downloads/"${PROSSH_FILE}" "${DIR}"/id_rsa > ~/.ssh/prossh
  chmod 600 ~/.ssh/prossh
  echo ${PROSSH_FILE} extracted, now sshing into ${PROSSH_IP}!
  ssh -A -i ~/.ssh/prossh -oStrictHostKeyChecking=no -oUserKnownHostsFile=/dev/null ${PROSSH_USER}@${PROSSH_IP}
}
Original credit and other OSes: https://gist.github.com/patrick0057/407f01a0d9dd98e88876c8eedc657aa8
scc-logs
Shell function to simplify the download of logs from a ticket folder in the SCC S3 bucket
function scc-logs {

##### Note, this assumes saml2aws is configured to manage a profile called "scc"
# See the steps for "Access via CLI" in: https://confluence.suse.com/display/SSTE/File+uploads+to+SUSE+Support

BASE_DIR="${HOME}/Downloads"
WORKING_DIR="$BASE_DIR/$1"

if [ -z "$1" ]
  then
    echo "No argument supplied"
    return 1
fi

if [ ! -d "$WORKING_DIR" ]
  then
    mkdir -p "$WORKING_DIR"
    cd "$WORKING_DIR"
    scc-login
    aws --region eu-central-1 --profile scc s3 sync s3://suse-customer-uploads/$1/ $WORKING_DIR/
  else
    echo "Dir already exists, switching to it"
    cd "$WORKING_DIR"
    if read -q "REPLY?Do you want to sync files from s3 again? (y/n) "
      then
        echo; scc-login
	aws --region eu-central-1 --profile scc s3 sync s3://suse-customer-uploads/$1/ $WORKING_DIR/
    fi
fi

}

function scc-login {

echo "Checking for credentials"
if ! aws --profile scc sts get-caller-identity >> /dev/null
  then
    echo "Credentials expired, logging in"
    saml2aws login
fi

}
ag / ack
A good alternative to
grep -r, fast recursive string matching.sshuttle
Route to a remote network over SSH, can be good for accessing air-gapped nodes in a cloud provider, for example:
sshuttle -r 54.153.190.253 10.99.0.0/16
Mock the vSphere API for testing
- Create a deployment and service in the Rancher local cluster to run the mock server:
cat <<'EOF' | kubectl create -f -
apiVersion: apps/v1
kind: Deployment
metadata:
  labels:
      app: vsphere-mock
  name: vsphere-mock
  namespace: default
spec:
  selector:
    matchLabels:
      app: vsphere-mock
  template:
    metadata:
      labels:
        app: vsphere-mock
    spec:
      containers:
      - args:
        - -l
        - 0.0.0.0:8989
        - -tls
        image: omniproc/vcsim
        name: vsphere-mock
---
apiVersion: v1
kind: Service
metadata:
  name: vsphere-mock
  namespace: default
spec:
  ports:
  - name: https
    port: 8989
    protocol: TCP
    targetPort: 8989
  selector:
    app: vsphere-mock
  type: ClusterIP
EOF
-
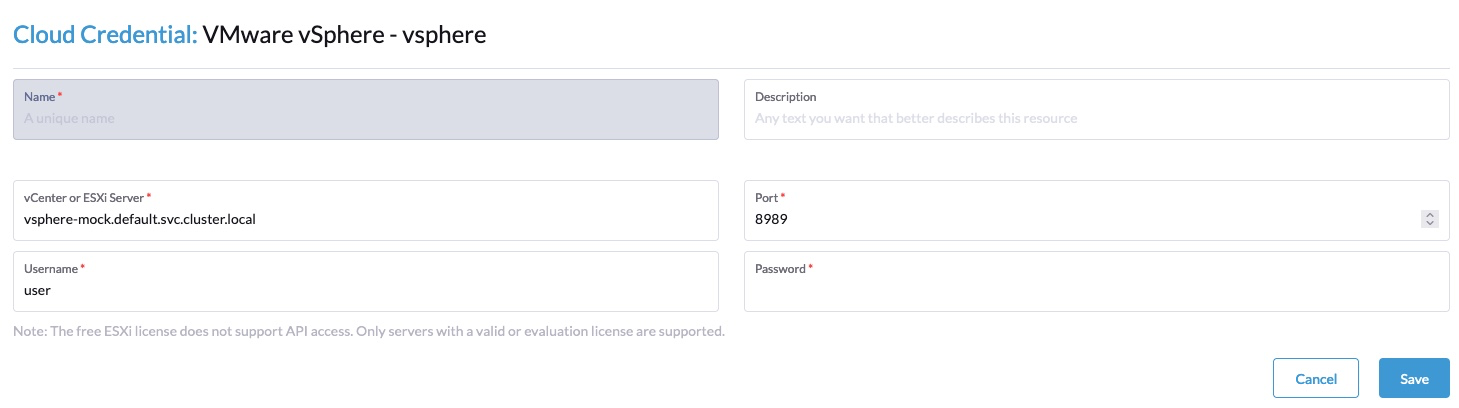
Create a vSphere cloud credential in the Rancher UI:
vsphere-mock.default.svc.cluster.localand port8989- Any user/pass will be accepted
-
Now you can create a node template using the provider, it will mock the datacenter and datastore etc.
Create a proxy for lab testing
cat <<'EOF' | kubectl create -f -
apiVersion: apps/v1
kind: Deployment
metadata:
  labels:
    app: proxy
  name: proxy
  namespace: default
spec:
  selector:
    matchLabels:
      app: proxy
  template:
    metadata:
      labels:
        app: proxy
    spec:
      containers:
      - args:
        - ANY
        image: stuntkiwi/tinyproxy
        name: tinyproxy
---
apiVersion: v1
kind: Service
metadata:
  name: proxy
  namespace: default
spec:
  ports:
  - name: proxy
    port: 3128
    protocol: TCP
    targetPort: 3128
  selector:
    app: proxy
  type: ClusterIP
EOF
Update your Rancher install to use the ClusterIP hostname/port:
helm upgrade rancher [...] \
 --set proxy=http://proxy.default.svc.cluster.local:3128 \
 --set noProxy=127.0.0.0/8\\,10.0.0.0/8\\,cattle-system.svc\\,172.16.0.0/12\\,192.168.0.0/16\\,.svc\\,.cluster.local
Example here: https://rancher.com/docs/rancher/v2.6/en/installation/other-installation-methods/behind-proxy/install-rancher/#install-rancher
Use an http echo container for ingress testing
Retrieving the headers from a request is sometime useful when testing different ingress-nginx configuration
Deploy the below to create a basic http-echo for requests, then use curl to get an echo of the headers:
curl --resolve test.com:80:<node or load balancer IP> http://test.com
cat <<'EOF' | kubectl create -f -
apiVersion: apps/v1
kind: Deployment
metadata:
  labels:
    app: http-echo
  name: http-echo
  namespace: default
spec:
  selector:
    matchLabels:
      app: http-echo
  template:
    metadata:
      labels:
        app: http-echo
    spec:
      containers:
      - name: http-echo
        image: mendhak/http-https-echo
---
apiVersion: v1
kind: Service
metadata:
  name: http-echo
  namespace: default
spec:
  ports:
  - name: http-echo
    port: 8080
    protocol: TCP
    targetPort: 8080
  selector:
    app: http-echo
  type: ClusterIP
---
apiVersion: networking.k8s.io/v1
kind: Ingress
metadata:
  name: http-echo
  namespace: default
spec:
  rules:
    - host: test.com
      http:
        paths:
          - backend:
              service:
                name: http-echo
                port:
                  number: 8080
            path: /
            pathType: Prefix
EOF
RKE2 commands
Quick setup for kubectl and crictl
export KUBECONFIG=/etc/rancher/rke2/rke2.yaml
export CRI_CONFIG_FILE=/var/lib/rancher/rke2/agent/etc/crictl.yaml
PATH="$PATH:/var/lib/rancher/rke2/bin"
alias k=kubectl
Log locations
RKE2 service logs
journalctl -fu rke2-server
##### OR
journalctl -fu rke2-agent
Kubelet logs only
tail -f /var/lib/rancher/rke2/agent/logs/kubelet.log
Component logs
#### kube-apiserver
kubectl logs -n kube-system -l component=kube-apiserver -f --tail 50
#### kube-controller-manager
kubectl logs -n kube-system -l component=kube-controller-manager -f --tail 50
#### etcd
kubectl logs -n kube-system -l component=etcd -f --tail 50c
#### kube-scheduler
kubectl logs -n kube-system -l component=kube-scheduler -f --tail 50
#### cloud-controller-manager
kubectl logs -n kube-system -l component=cloud-controller-manager -f --tail 50
Other components run as static pods, locate their logs (
0.log) in:tail -f /var/log/pods/[...]
If the kube-apiserver and kubelet are responsive,
kubectl can also be usedEtcd snapshots
On demand snapshot,
--name is optionalrke2 etcd-snapshot --name <name>
Windows
Event Log for RKE2
Get-EventLog -LogName Application -Source 'rke2' -Newest 500 | format-table -Property TimeGenerated, ReplacementStrings -Wrap
Other great Windows RKE2 troubleshooting references:
- https://github.com/rosskirkpat/docs/blob/main/rke2/rke2-windows-troubleshooting-qa.md
- https://gist.github.com/superseb/3b78f47989e0dbc1295486c186e944bf?permalink_comment_id=4204052#gistcomment-4204052
Quick start cloud-init (single server node)
#!/bin/sh

PUBLIC_IP=$(curl ifconfig.io)

##### export INSTALL_RKE2_VERSION="v1.20.5+rke2r1"

curl -sfL https://get.rke2.io | sh -
mkdir -p /etc/rancher/rke2
cat > /etc/rancher/rke2/config.yaml <<EOF
write-kubeconfig-mode: "0640"
tls-san:
  - "${PUBLIC_IP}"
  - "${PUBLIC_IP}.nip.io"
EOF

systemctl enable rke2-server
systemctl start rke2-server

cat >> /etc/profile <<EOF
export KUBECONFIG=/etc/rancher/rke2/rke2.yaml
export CRI_CONFIG_FILE=/var/lib/rancher/rke2/agent/etc/crictl.yaml
PATH="$PATH:/var/lib/rancher/rke2/bin"
alias k=kubectl
EOF
Quick start cloud-init with Rancher installed (single server node)
#!/bin/sh

PUBLIC_IP=$(curl ifconfig.io)

##### Note, you may need to pin a specific RKE2 version below as the latest RKE2 version can be higher than versions supported by Rancher
##### https://github.com/rancher/rke2/tags

##### export INSTALL_RKE2_VERSION="v1.20.5+rke2r1"

curl -sfL https://get.rke2.io | sh -
mkdir -p /etc/rancher/rke2
cat > /etc/rancher/rke2/config.yaml <<EOF
write-kubeconfig-mode: "0640"
tls-san:
  - "${PUBLIC_IP}"
  - "${PUBLIC_IP}.nip.io"
EOF

systemctl enable rke2-server
systemctl start rke2-server

cat >> /etc/profile <<EOF
export KUBECONFIG=/etc/rancher/rke2/rke2.yaml
export CRI_CONFIG_FILE=/var/lib/rancher/rke2/agent/etc/crictl.yaml
PATH="$PATH:/var/lib/rancher/rke2/bin"
alias k=kubectl
EOF

cat > /var/lib/rancher/rke2/server/manifests/rancher.yaml << EOF
apiVersion: v1
kind: Namespace
metadata:
  name: cattle-system
---
apiVersion: helm.cattle.io/v1
kind: HelmChart
metadata:
  name: cert-manager
  namespace: kube-system
spec:
  targetNamespace: cert-manager
  createNamespace: true
  repo: https://charts.jetstack.io
  chart: cert-manager
  version: v1.15.3   # change as needed!
  set:
    crds.enabled: "true"
---
apiVersion: helm.cattle.io/v1
kind: HelmChart
metadata:
  name: rancher
  namespace: kube-system
spec:
  targetNamespace: cattle-system
  repo: https://charts.rancher.com/server-charts/prime
  chart: rancher
  version: v2.9.1   # change as needed!
  set:
    hostname: $PUBLIC_IP.nip.io
    replicas: 1
EOF